
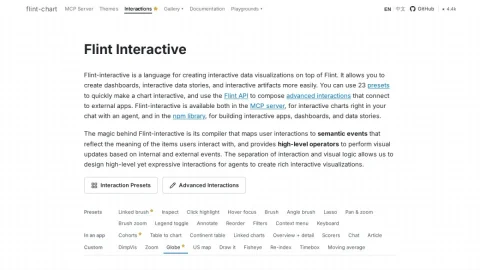
Flint positions itself as a visualization language built for the AI era, hosted on GitHub Pages by Microsoft. Rather than another charting library, it offers a declarative layer for describing charts so the same specification can be compiled to different rendering backends. That makes it relevant to anyone who wants chart definitions to stay portable as tooling changes.
The core idea is a compact, readable spec covering chart types, data encoding, and interactive behaviors. The interactions section shows how selections, highlighting, and linked views are expressed in the language rather than written as imperative event handlers. Because the output targets existing engines, teams keep familiar rendering while gaining a shared, machine-friendly description format.
It is aimed at developers building dashboards and data applications, plus teams experimenting with LLM-driven chart generation where a structured spec is easier for a model to produce and validate than raw library code. Analysts comfortable with configuration files may also find it approachable.
A sensible approach is to start with the interaction examples, reproduce a chart you already have, and compare the generated output against your current implementation. Check which backends are supported before committing, since portability depends on that coverage. Flint is best treated as a specification layer over your existing chart stack rather than a replacement for it.

评论与评分
0还没有评论,来写下第一条评价吧。