
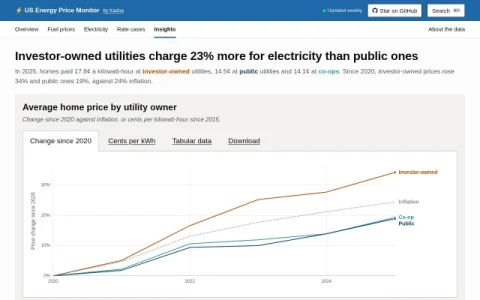
US Energy Price Monitor is a data project from Kadoa that publishes electricity price statistics for American households. Its electricity section breaks average residential rates down by utility ownership type—investor-owned, public, and cooperative—and tracks how those prices have moved since 2015, with a headline finding that investor-owned utilities charged 23% more per kilowatt-hour than public ones in 2025.
The core of the site is a set of interactive charts and tables. Users can switch between viewing change since 2020 and cents per kilowatt-hour, and the data table lists yearly averages alongside inflation, plus estimated monthly bills for each ownership category. Tabular data can be downloaded, and the site also covers fuel prices and rate cases as separate sections.
It is aimed at people who need credible, citable figures rather than marketing claims: policy analysts, energy journalists, students, and curious homeowners who want to understand why their bill differs from a neighbor’s. Because the numbers come from EIA annual data and are updated weekly, it works well as a reference point in articles or reports.
A practical tip is to use the download option when you need to run your own comparisons, and to check the “About the data” page for methodology before citing figures. The site is not a rate calculator for a specific address, so treat state and ownership averages as context rather than a personal quote. Overall, it is a compact, transparent reference for US r


Comments & Ratings
0No comments yet. Be the first to review.